Book Images
All the images in our books are published under creative commons, and thus feel free to use them in your own presentations or material.
Currently we have these book images available:
- Large-Scale Scrum - More with LeSS
- Practices for Scaling Lean and Agile Development
- Scaling Lean and Agile Development
Book images from Large-Scale Scrum: More with LeSS
The following images are from Large-Scale Scrum: More with LeSS - Craig Larman, Bas Vodde:
Chapter 2
 LeSS Complete Picture
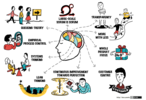 LeSS Principles
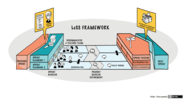 LeSS Framework
 Sprint Planning One - Story Sketch
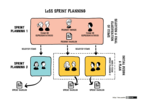 Sprint Planning
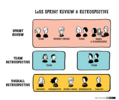 Sprint Review & Retrospective
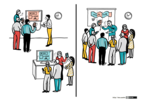 Sprint Review Bazaar - Story Sketch
 Product Managers Discuss - Story Sketch
 Multi-Team Product Backlog Refinement - Story Sketch
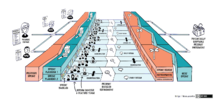 LeSS Huge Framework
 Splitting at the Whiteboard - Story Sketch
 Multi-site estimation with Planning Poker - Story Sketch
Chapter 3
 LeSS Volunteers
 Coaching
Chapter 4
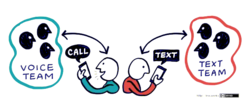 Organizing by Customer Value
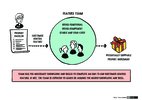 Figure 4.1 - Feature Team
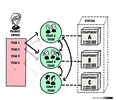 Figure 4.2 - Component Teams Model
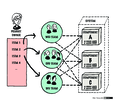 Figure 4.3 - Feature Teams Model
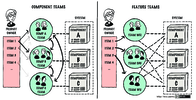 Figure 4.4 - Component vs Feature Teams
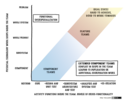 Figure 4.5 - Feature Team Adoption Map
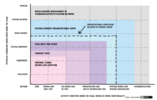 Figure 4.6 - Feature Team Adoption Map - Example Telecom
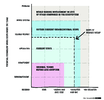 Figure 4.7 - Feature Team Adoption Map - Example Finance
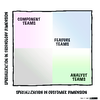 Figure 4.8 - Two Dimensions of Specialization
 People Structure
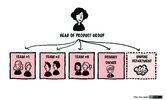 Figure 4.9 - Typical LeSS Organizational Chart
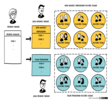 Figure 4.10 - Requirement Areas
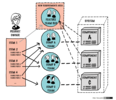 Figure 4.11 - Grow a Parallel Organization
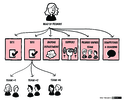 Figure 4.12 - Typical LeSS Huge Organizational Structure
Chapter 5
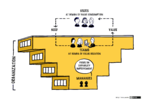 Figure 5.1 - LeSS Organization
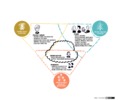 Figure 5.2 - Responsibilities of the LeSS Roles
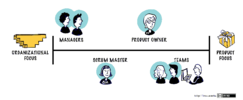 Figure 5.3 - Product and Organizational Focus of the Roles
Chapter 6
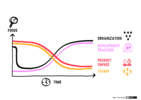 Figure 6.1 - Scrum Master Focus Over Time
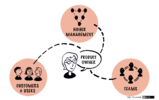 Figure 6.2 - Product Owner Relationships
 Figure 6.3 - Product and Organizational Focus of the Roles
Chapter 8
 Figure 8.1 - Types of Development and the Product Owner Location
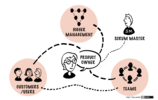 Figure 8.2 - Product Owner Relationships
Chapter 9
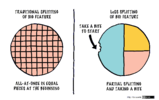 Figure 9.1 - Partial Splitting and Taking a Bite
 Figure 9.3 - New Area with Only One Item
 Figure 9.4 - Backlog Refinement before Joining New Area
 Figure 9.5 - Building the Bite while Refining New Items
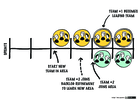 Figure 9.6 - Adding New Teams and Having a Leading Team
Chapter 10
 Figure 10.1 - Definition of Done
 Figure 10.2 - Growing a One Sprint of Undone Work
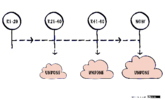 Figure 10.3 - Piling up Three Sprints of Undone Work
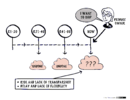 Figure 10.4 - Undone Work Causing Risk and Delay
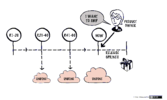 Figure 10.5 - Bad Idea: Doing Undone Work using Release Sprint
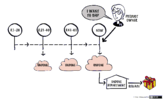 Figure 10.6 - Bad Idea: Doing Undone Work using Undone Department
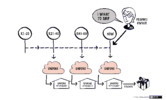 Figure 10.7 - Bad Idea: Doing Undone Work using Pipelining
Chapter 11
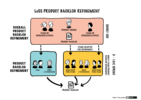 Figure 11.1 - Product Backlog Refinement
Chapter 12
 Sprint Planning
Chapter 13
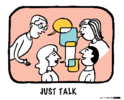 Just Talk
 Communicate in Code
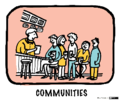 Communities
 Cross Team Meetings
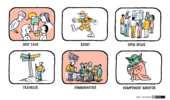 Component Mentors
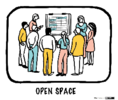 Open Space
 Travelers
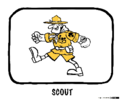 Scouts
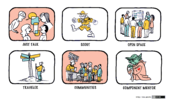 Mix and Match
Chapter 14
 Sprint Review and Retrospective
Book images from Practices for Scaling Lean and Agile Development
The following images are from Practices for Scaling Lean and Agile Development - Craig Larman, Bas Vodde:
Book Cover
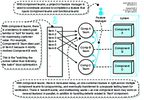 Component Teams
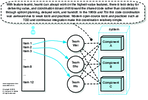 Feature Teams
Chapter 2
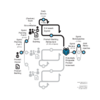 Figure 2.1: Large-Scale Scrum, Framework-1 (LeSS)
 Figure 2.1: Large-Scale Scrum, Framework-2 (LeSS Huge)
Chapter 3
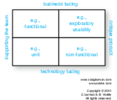 Figure 3.1: Marick’s Test Categories
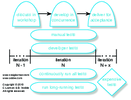 Figure 3.2: Testing Activities in an Iteration
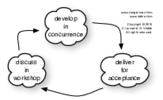 Figure 3.3: A-TDD Overview
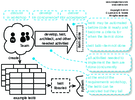 Figure 3.4: A-TDD in More Detail
 Figure 3.5: Conventional Document-centric Style of Requirements Clarification
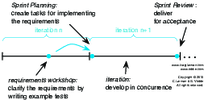 Figure 3.6: A-TDD Steps Mapped to Scrum Iteration
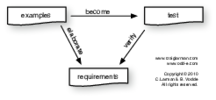 Figure 3.7: Relationship Between Examples, Tests, and Requirements
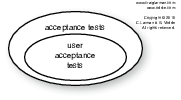 Figure 3.9: UAT is a Subset of Acceptance Tests
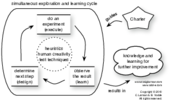 Figure 3.10: Overview of Exploratory Testing
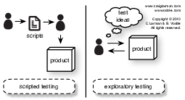 Figure 3.11: Difference Between Scripted And Exploratory Testing
 Figure 3.17: Robot Framework Architecture
Chapter 4
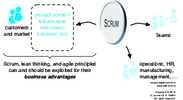 Figure 4.1: Business-Facing Change-Opportunities when Adopting Scrum
 Figure 4.2: Scrum May Contribute To Business Objectives
 Contract Game Figure 1
 Contract Game Figure 2
 Contract Game Figure 3
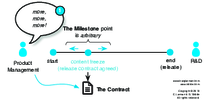 Contract Game Figure 4
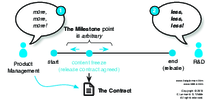 Contract Game Figure 5
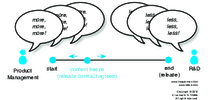 Contract Game Figure 6
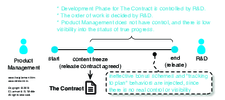 Contract Game Figure 7
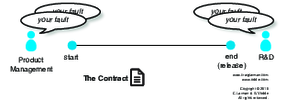 Contract Game Figure 8
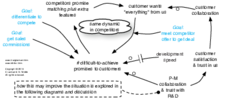 Feature War Causal Loop
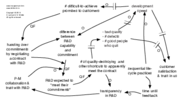 Contracts in R&D Causal Loop
 Lack of Product Management Collaboration Causal Loop
 Total Picture Product Management Causal Loop
 Figure 4.4: Take On A Common Goal Rather Than Create a Platform Group
 Product Management - Product Owner Venn Diagram
Chapter 5
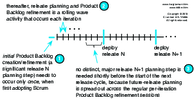 Figure 5.1: Initial Product Backlog Creation Happen Once
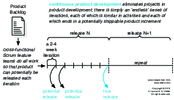 Figure 5.2: Continuous Product Development
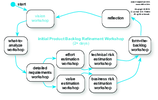 Figure 5.3: Sample Activities In Kickoff Workshops
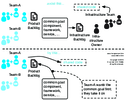 Figure 5.7: Feature Teams and not Seperate Infrastructure Groups
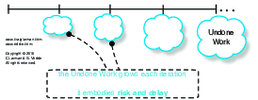 Figure 5.8: Undone Work Grows Over Time
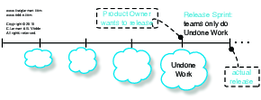 Figure 5.9: Release Sprint
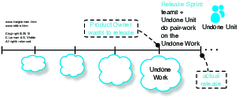 Figure 5.10: Teams Do a Release Sprint with the Undone Unit
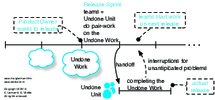 Figure 5.11: Undone Unit After One Release Sprint
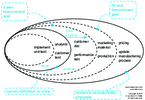 Figure 5.12: Expand Done Over Time
Chapter 6
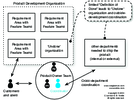 Figure 6.1: Role for Coordinator Between Departments
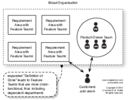 Figure 6.2: Full Cross-Functional Integration
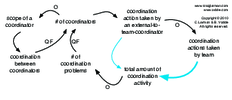 Figure 6.3: Effect of Team-External Coordinator Role
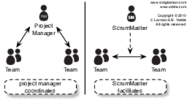 Figure 6.4: One Difference Between Project Manager and Scrum Master Role
Chapter 7
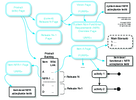 Figure 7.1: Artifacts
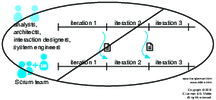 Figure 7.2: Avoid Seperate Analysis Groups and Fake Team Members that Hand Off Requirements
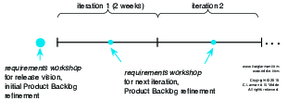 Figure 7.3: Timing of Requirement Workshops
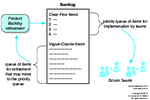 Figure 7.5: Refine the Backlog Incrementally
 Experiment with Many Analysis Techniques 1
 Experiment with Many Analysis Techniques 2
Chapter 8
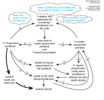 Figure 8.1: Architecture Metaphore Causal Loop
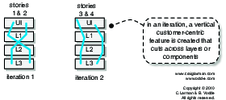 Figure 8.8: Incrementally add Features Across Layers
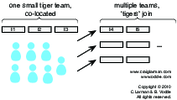 Figure 8.9: Start Programming a New Product with one Tiger Team
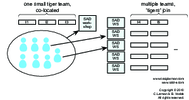 Figure 8.10: A Time To Get SAD
Chapter 9
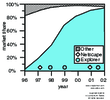 Figure 9.1: Browser Market Share and Releases
 Figure 9.2: Dynamics of Unrealistic Deadline
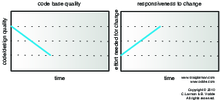 Figure 9.3: Code Quality Decreases Over Time
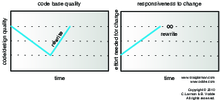 Figure 9.4: Rewite Increases Code Quality
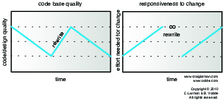 Figure 9.5: Code Base Quality Degrades Again After The Rewrite
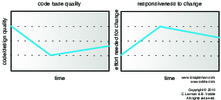 Figure 9.6: Growing the Code Healthfully
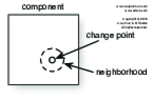 Figure 9.7: Clean Up Your Neighborhood
Chapter 10
 Figure 10.1: Growing versus Building
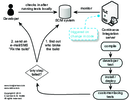 Figure 10.2: CI System
 Figure 10.3: The Dynamics of Broken Builds
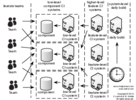 Figure 10.4: Scaled CI System
Chapter 11
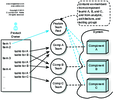 Figure 11.1: Gradual Transition from Component to Feature Teams
 Joint Retrospective
Chapter 12
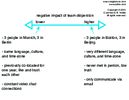 Figure 12.1: Varying Impacts of Team Dispersion
Chapter 13
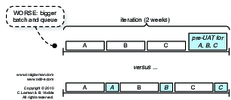 Figure 13.11: pre-UAT After Each Feature
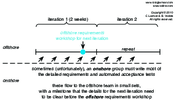 Figure 13.12: Iterative Requirements Onshore to Offshore
Chapter 14
 Figure 14.2: System Dynamics of Degree of Contract Flexibility and Early Lawyer Collactoration
Chapter 15
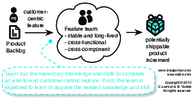 Figure 15.1: Feature Team
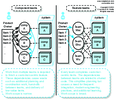 Figure 15.2: Feature vs. Component Teams
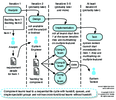 Figure 15.3: Some Drawbacks of Component Teams
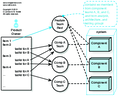 Figure 15.4: Gradual Transition from Component to Feature Teams
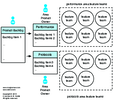 Figure 15.5: Requirement Areas
Book images from Scaling Lean and Agile Development
The following images are from Scaling Lean and Agile Development - Craig Larman, Bas Vodde:
Chapter 2
 Variables in a Causal Loop Diagram
 Effects in a Causal Loop Diagram
 Unknown Effect in a Causal Loop Diagram
 Opposite Effect in a Causal Loop Diagram
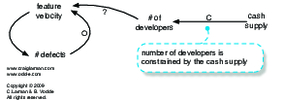 Constraints in a Causal Loop Diagram
 Goals in a Causal Loop Diagram
 Measurement Dysfunction Causal Loop
 Measurement Dysfunction with Go See Causal Loop
 Quick-Fix Causal Loop Diagram: Hire More Developers
 Quick-Fix Causal Loop Diagram: Hire Cheap Developers
 Extreme Effect Causal Loop Diagram: Cheap Low-Skilled Developers
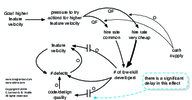 Delay in a Causal Loop Diagram: Low-Skilled and Code Quality
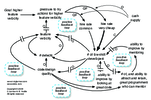 Positive Feedback Loops: Quality of Developers Relationship to Quality of Code
 Mental Model in Causal Loop: Developers Make Us Go Faster
 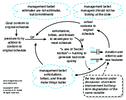 Figure 2.2: Developers Secret Toolsbox Causal Loop
 Figure 2.3: Developers Secret Toolbox and Bug Fixing Delay Causal Loop
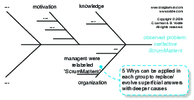 Figure 2.6: Ishikawa Diagram
Chapter 3
 Figure 3.1: Lean Thinking House
 Small Lean Thinking House
 Figure 3.2: Respect For People
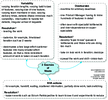 Figure 3.6: Three Sources of Waste
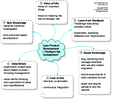 Figure 3.8: How to Outlearn The Competition
 Figure 3.9: Lean Product Development Practices
Chapter 4
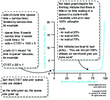 Figure 4.1: Thinking Mistake Regarding Queues in Systems with Variability
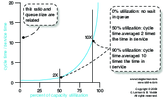 Figure 4.2: Basic M/M/1/inf Queue
 Figure 4.3: M[X]/M/1/inf Queue More Common in Product Development with Variable Batches
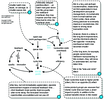 Figure 4.5: Benefits of Reducing Batch and Cycle Size
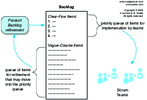 Figure 4.6: Product Backlog Contains Several Queues
Chapter 5
 Figure 5.1: Cockburn Scale
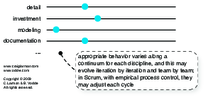 Continuum of Practices
Chapter 7
 Figure 7.1: What is a Feature Team
 Figure 7.3: Component Teams Leads to Waterfall Development
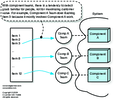 Figure 7.4: Component Teams Leads to Less Valuable Features Being Developed
 Figure 7.5: Component Teams Leads to Ever-growing Development Groups Causal Loop Diagram
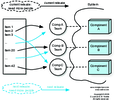 Figure 7.6: Component Teams Leads to Ever-growing Development Groups Picture
 Figure 7.7: Component Teams Leads to Challenges in Planning and Coordination
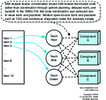 Figure 7.8: Feature Teams Switch the Coordination Problem to Code
 Figure 7.9: Feature Teams Still Have Specialization
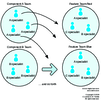 Figure 7.11: Transitioning to Feature Team by Reorganizing
Chapter 8
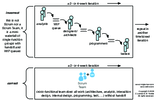 Figure 8.1: Cross-Functional Teams. Not Single Function Groups
 Figure 8.2: Team Performance Increases over Time
 Figure 8.3: Large-scale Scrum Teams
 Figure 8.4: Mismatch Between Skills Needed for a Backlog Item and Skills in the Team
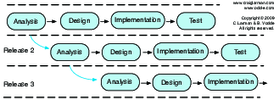 Figure 8.5. Not Recommended: Parallel Releases
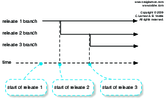 Figure 8.6: Parallel Releases Lead to Staircase Branching and Leads to a lot of Waste
 Figure 8.7: Recommended: Mainline Development
Chapter 9
 Figure 9.1: Requirement Area Grouping in the Product Backlog
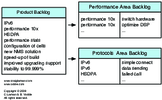 Figure 9.2: Views on the Product Backlog are Created called Area Backlogs
 Figure 9.3: Every Area has an Area Product Owners
 Figure 9.4: Feature Teams Work inside One Area Teams
Chapter 10
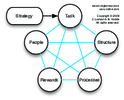 Figure 10.1: Galbraiths Star Model for Organizational Design
 Figure 10.2: Continuous Product Development (without projects)
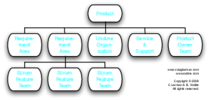 Figure 10.3: Example Organizational Chart for an Feature Team/Requirement Area Organization
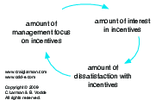 Figure 10.4: Focus of Incentives Increases Dissatisfaction Causal Loop Diagram
 Figure 10.5: Joel Spolskys Business Plan
Chapter 11
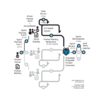 Figure 11.1: Large Scale Scrum Framework 1 for up to Ten Teams (LeSS)
 Figure 11.2: Large Scale Scrum Framework 2 for More Than Ten Teams (LeSS Huge)
Unpublished
 Unpublished - Scrum with one team
